In my last post, I made mention of the fact that the Linux binary we use to connect Polaris to your syslog collector doesn’t start at boot and if you log off will be killed. I thought about that and decided that it would be stupid not to note how to make it automatically start on boot. I mean, why would you not?
The process itself is not complicated. In days of old you would have used /etc/init.d to configure services, these days we use a process called systemd. There are a couple of tricks to getting the rbk-log tool to work as it requires either switches or environment variables, and as we used environment variables the last time round, I’m going to stick with that.
So what steps do we need to take to make the magic happen?
Download the rbk-log tool if you haven’t already
Save the file to a home directory and make it executable
Configure the syslog service locally
Create the systemd service definition file
Start the rbk-log service to make sure it starts properly
Enable the service to auto start on boot
Downloading the rbk-log tool
You can get this tool from the Rubrik Support website, under Downloads. See my Sentinel blog post prior to this to see where it lives.
Save the file to a home directory and make it executable
As I’m using Ubuntu on EC2 for this example, there is a user created during VM provisioning called ubuntu. As it has a home directory already created, I’d recommend dropping the tool in there. To make it executable, run chmod ugo+x rbk-log. If you do an ls -l, it should look like the following :-
Saving rbk-log and making it executable for all
Create the systemd service definition file
We then need to create a small configuration file for the rbk-log tool so that systemd knows how the service should run and what other information it needs to start successfully. To save time, I’ve copied my definition file below :-
The file itself should be pretty self explanatory, just copy the file and put it into /etc/systemd/system and name it rbk-log.service. The full path to the saved file should be /etc/systemd/system/rbk-log.service
You will then need to go in and check the ExecStart parameter to make sure the path to the rbk-log tool executable is correct.
You will also need to configure the environment variables to match your configuration, so the three values in bold and the pointy brackets need to be amended. Save the file away when you’re done, if you get any permissions errors, remember you will probably need to run your text editor with the sudo command.
sudo vim /etc/systemd/system/rbk-log.service
Start the rbk-log service to make sure it starts properly
In order for systemd to refresh the config files, issue a sudo systemctl daemon-reload command at the prompt. This should be instant. Once you’ve reloaded systemctl, we can issue the command to start the rbk-log service :-
sudo systemctl start rbk-log.service
Wait a few seconds for the service to start and then issue a status command, to make sure it has started up properly.
sudo systemctl status rbk-log.service
All being well, you should see something similar to below :-
Checking the status of the rbk-log service
You can also issue a tail -f /var/log/syslog command to watch the tail of the syslog file to perform any necessary troubleshooting.
Viewing the syslog file for errors
Enable the service to auto start on boot
All being well at this stage, we can now enable the service to start automatically on boot :-
sudo systemctl enable rbk-log
That’s it! You may wish to reboot the VM just to make sure the service auto starts, just as a precaution.
First blog in nearly two years, so let’s make it something of substance, eh? I’ve been at Rubrik now since April and it already feels like a long time (in a good way) and as folks who know me know I like to tinker around the edges and build stuff. As such, I hear many enquiries about how we can hook up Rubrik Polaris to Azure Sentinel, so this is how you do it.
What is Rubrik Polaris?
Polaris is the SaaS based management plane for Rubrik clusters, wherever they may reside. It allows cluster owners to manage their estate via a web browser from one point, reducing admin overhead and providing the capability to add new features to our already market leading backup solution.
As well as providing the management plane, it also extends the product capability to include ransomware recovery tooling (Radar), data classification (Sonar) and orchestrated disaster recovery (AppFlows). All of this is done in situ on the Rubrik appliance, with metadata and signals being transmitted to the Polaris cloud. Customer data never leaves the appliance, and this is important.
What is also important is that we do all of this without the need for any additional infrastructure, such as software virtual appliances or proxy servers. As you’d expect, we log all events centrally and these can be managed via the Polaris web interface. That’s great, but what if you have an existing investment into a SIEM tool? What we don’t want to do is ask the SOC/NOC teams to log into yet another interface to view activity in the environment.
In response to this, we made a tool available to pull Polaris events out in syslog format, which is kind of a Swiss Army Knife of log formats that just about any SIEM tool will ingest. This means that we can now ingest Polaris events and push them into your SIEM of choice.
Rubrik Polaris GPS console
What is Azure Sentinel?
Azure Sentinel is Microsoft’s SIEM tool in the cloud. It’s incredibly popular with Azure customers and is used as a general sink for all log events, regardless of where they originate from. Customers like the range of integration options, limitless scaling and pay as you go pricing. It’s a convenient way to bring logs to a central point. As you’d expect from Microsoft, there is an extensive list of integration options with third parties.
Azure Sentinel console
Integrating Polaris with Sentinel
So to the main thrust of this post, how do we bring the two together? First up, we need to meet some pre-requisites :-
Linux VM in Azure
rbk-log tool from Rubrik
Azure Sentinel workspace
Rubrik Polaris account
Provisioning the Linux VM
First we need to provision a Linux machine in Azure. What do we need this for? Well we need a Linux box to basically act as our syslog forwarder (this can be used in any syslog based scenario) and is the method Microsoft uses and recommends. In short, your Linux box ingests syslog messages from your connected system, sends them to the Log Agent on the same box and that agent sends them up to Sentinel.
Because Sentinel is not a “typical” centralised syslog server as such, because we’re not piping logs to an IP address or hostname, we’re sending it to a webscale, distributed platform where things such as IP addresses are obfuscated from us. This is where the Log Agent handles all of that for us.
The diagram below from the Azure documentation site shows how the internal communication happens on the Linux VM syslog forwarder. A picture says a thousand words!
The Log Agent/syslog architecture within the syslog VM
So first up, let’s get an Linux VM. By using one straight out of Azure, we get the benefit of selecting an image with the Log Analytics agent already installed. This will save us some time.
From the Azure console, select Create a resource
In the search bar, type Ubuntu (or whatever your chosen distro is, but these instructions will focus on Ubuntu)
(Optional) Toggle the Pricing button to Free (because I’m tight). This means you only pay for compute.
Choose a Linux image. For the purposes of this guide, I’m going to use the Cognosys image
Choosing the Ubuntu image
Click Create
Follow the provisioning wizard, I recommend an A2 instance type for cost reasons (this can always be changed later if required)
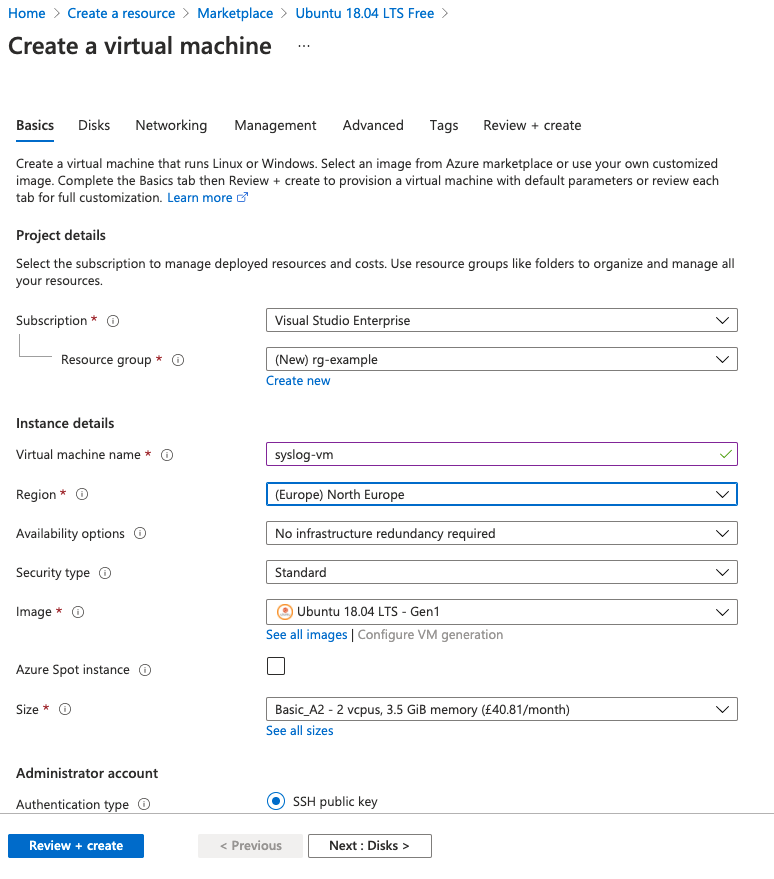
Accept the default settings for a quick deployment, or feel free to customise the VNet settings, authentication type, tags etc. Ensure a Public IP address is created and assigned to the VM (this is the default behaviour). I set the authentication type to password. This is so that the provisioning process automatically creates a non-root user on the VM with a home area. This is an optional step, however.
Click Review + Create
VM creation screen
Obtaining the rbk-log tool
The next step is to download the rbk-tool to connect to Polaris. We obtain this from the Rubrik Support site, so credentials will be required and a product entitlement also.
In the Docs and Downloads section, click View Downloads
Click Rubrik Polaris SaaS Platform (usually at the bottom of the list)
Under Software, click the Download button to the right of rbk-log
Under Documentation, you may also find it useful to download the Rubrik rbk-log Version 1.0 Technical Reference.pdf guide
Once the rbk-log tool has been downloaded, copy it to the Linux VM
Copy the tool to be on the PATH, so we can run it from anywhere on the filesystem. Type export to see what the PATH variable currently contains
export output
Once the tool has been copied to it’s final resting place, change the permissions on the file by typing chmod 755 rbk-log
The final configuration step is to set the required connection parameters for Polaris. This can be found in the Technical Reference guide, but for quick reference, these environment variables shown below. The RUBRIK_POLARIS_ACCOUNT URL must represent your Polaris tenant URL. Similarly, the RUBRIK_POLARIS_USERNAME and RUBRIK_POLARIS_PASSWORD variables should represent a discrete syslog user in your tenant (using an existing admin account is not recommended as passwords can change and MFA can cause issues with the connection). Also, having a suitably named account will help identify account activity much more easily. PIC
As per the Technical Reference guide, you should set these environment variables in the .bashrc file of the Linux user used to run the tool, so that the values are always available on login.
Environment variables required for the rbk-log tool
Configuring the syslog daemon
We need to check that the syslog daemon has been enabled, configured and set to run on boot. On this particular image, we just have a couple of configuration steps.
Edit the file /etc/rsyslog.conf
Find the sections commented “provides UDP syslog reception” and “provides TCP syslog reception” and uncomment the following two lines, as per below picture
Restart the syslog service by typing sudo service rsyslog restart
Testing the Polaris connection
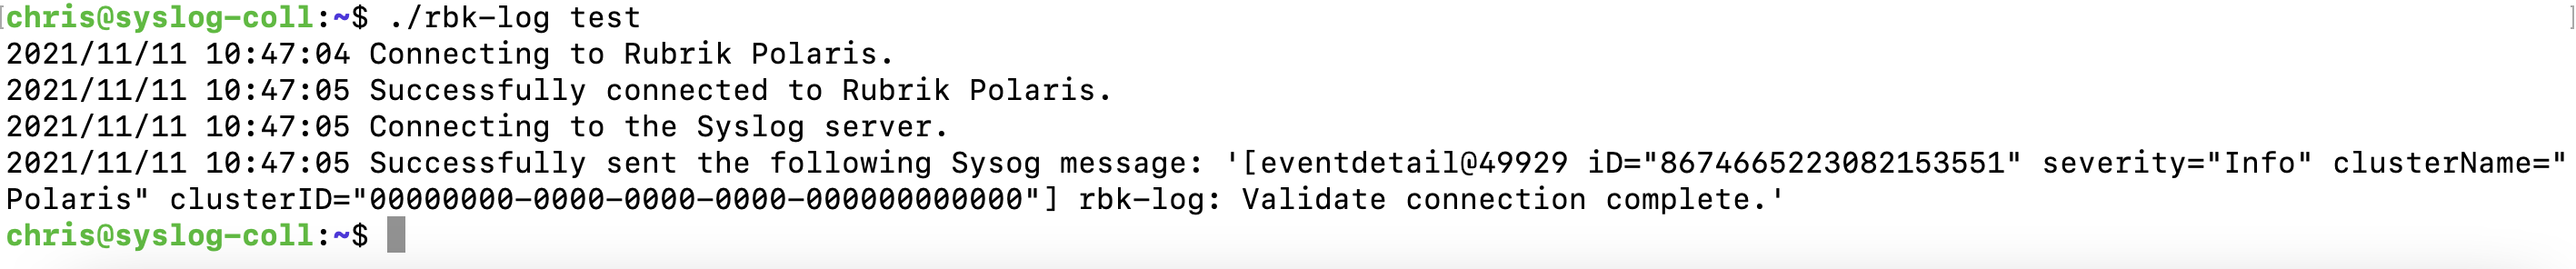
Now the syslog daemon has been configured and started, we can verify a connection to our Polaris tenant to make sure communications are working properly. First, verify that your environment variables have been set as per the previous section. Once this has been verified, run ./rbk-log test and review the result. A successful connection response is shown below. If you do not see something similar, go back and verify your environment variable settings, this is the most common problem.
Successful test result
If the connection test is successful, you can move ahead and start the tool and begin collecting events from Polaris. These will be fed into the local syslog on the Linux VM and then ultimately moved up into Sentinel. Start the tool by typing rbk-log start.
You may notice at this stage that because we are running this from the command line, if we do a CTRL-C or CTRL-D then the tool stops and so does Polaris event collection. An option here is to hit CTRL-Z to stop the process and then type bg to run the process in the background. This will allow us to check the syslog file itself to see if events are being pulled in.
The better strategy is to turn the tool into a daemon so it starts on system boot up. This beyond the scope of this guide, but this link may help .
Verifying the Polaris events in syslog
The next step is to ensure Polaris events are being pulled locally into the syslog, before we send them up to Sentinel. To do this, you can type tail -f /var/log/syslog, this will give you a “live feed” of the syslog as it us updated. If things are working properly, you should see similar results to the picture below.
Polaris events in syslog
In the syslog I can see a lot of login requests against my username. This is being done by the rbk-log tool and can skew log results as we discussed earlier. This is why having a dedicated account for log collection makes sense. Call the account rbk-syslog or something, but this account must have a working e-mail address so the account can be activated properly.
Connecting the Linux VM to Sentinel
Now the final configuration step – connecting the Linux syslog VM to Sentinel. This is done from the Sentinel page in the Azure Portal. These steps assume that you have a Sentinel workspace already configured. If you don’t, set one up as per the Azure documentation.
From the Sentinel blade, select your workspace and click the Data connectors link under Configuration (usually at the bottom of the blade).
Data connectors screen
In the search by name or provider box, type syslog and the Open Connector page.
There are two steps to configuring syslog ingestion into Sentinel – the first one is onboarding the Linux Agent and the second is choosing which types of syslog events we want to capture.
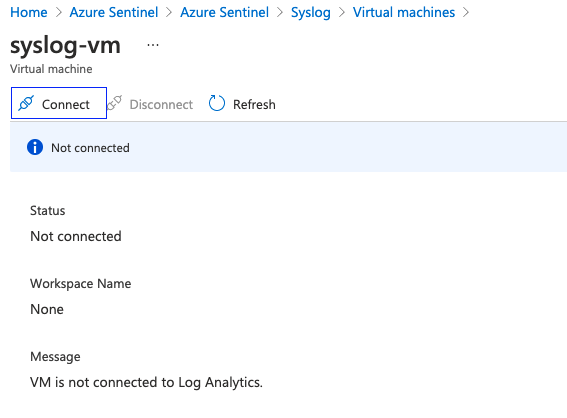
First up, open the Install agent on Azure Linux Virtual Machine section and click Download & install agent for Azure Linux Virtual machines. This takes you through to a page where all of your Linux VMs are listed with their connection status. Your newly provisioned VM will show as Not Connected. Let’s sort this!
VM connection status
Click on your syslog VM and in the following screen, click Connect. This will connect the VM to your Sentinel workspace. This can take several minutes, so be patient!
Sentinel VM connection screen
You can view the status of the process by typing top on your Linux VM and observing the processes at work.
Pro tip – if the connection times out, look for a process on the VM called unattended-upgrades. This is a process added to Ubuntu to automatically install security patches out of the box. This will hold a lock on the package database and prevent the connection process from completing. You can either wait for this process to finish or rebooting the VM and quickly restarting the connection process before the unattended-upgrades process kicks in worked for me.
Following the connection page. the final step is to configure which syslog event types we want to capture. This means we can scope down the collection and reduce the amount of noise. Click Open your workspace agents configuration > to view the syslog event types for collection (or “facilities” in syslog parlance).
Polaris events are logged under the kern facility, so click Add Facility and search for and add kern. You can also scope the level of events you want to capture (debug, warning, etc.), but I just accepted the defaults of all levels. I also added the priv and addpriv facilities so we can also capture local Linux events.
Running a basic Sentinel query to verify Polaris events are being ingested
Now that we have been through all the steps of configuring the syslog forwarded VM and connecting it to Sentinel, now to query the logs! Sentinel uses a query language called KQL (Kusto Query Language). It’s fairly easy to write a simple query, but more advanced KQL is well outside of the scope of this guide.
A simple KQL query to view all Polaris events is
Syslog
| where SyslogMessage contains "Polaris"
This query should yield results from Polaris, though you may need to be patient for a few minutes while all the different processes hook up and synchronise.
You can see below the results of our simple query and you will notice that all of the pertinent Polaris information is held in the SyslogMessage field. This means we can construct our queries against this value. For example, if someone is trying to brute force an admin account, we can search for this in Sentinel.
Using an AND logical operator, we can pull out login failure events using the following KQL :
Syslog
| where SyslogMessage contains "Polaris"
    and SyslogMessage contains "Failure"
    and SyslogMessage contains "failed to login with invalid password."
Conclusion
Hopefully this article has given you a good starting point for ingesting Polaris events into Sentinel and how you can construct some basic queries to assess the overall health and security of your Polaris tenant.


You must be logged in to post a comment.